Why Rent vs. Buy Matters for Landscaping Businesses
Landscaping operators face constant equipment decisions: rent a chipper for a single job or buy one for repeated use. They weigh cash flow, total cost of ownership, operational flexibility, and risk. A RENT vs BUY calculator turns guesswork into repeatable analysis by quantifying these trade-offs. This article tests that tool in practical settings and shows when its outputs should be trusted.
It explains how the calculator works, the key inputs landscaping businesses must provide, and the assumptions behind the testing methodology. Three real-world case studies reveal performance across small, medium, and large operators. Finally, sensitivity and break-even analysis highlight which variables move the needle and offer a concise implementation checklist, clear guidance.


Rent
How a Rent vs. Buy Calculator Works: Metrics and Outputs That Matter
What the calculator actually measures
A rent vs. buy calculator strips a messy decision into comparable pieces. It translates irregular rental days and hourly use into annualized figures by multiplying jobs per year by hours or days per job, factoring seasonality (peak months vs. slow months) and planned downtime. That yields comparable units: cost per year, cost per operating-hour, and cost per job.
Core financial metrics (what to look for)
Non-financial considerations the calculator flags
What outputs are most actionable
A good tool returns annual cost, cost per hour, breakeven year, NPV sensitivity to discount rate, and a scenario table (high vs. low utilization). Practically, users should run two utilization cases, include conservative maintenance and resale estimates, and test a higher discount rate if capital is scarce—those assumptions move the needle most.
Key Inputs for Landscaping Businesses: What to Feed the Calculator
Financial inputs: the hard numbers
Landscaping firms should start with clear, local figures. Key numeric inputs are:
Operational inputs: how the machine will actually be used
Convert job counts and schedules into hours:
Equipment-specific considerations
Different machines change the math:
Include model examples (Husqvarna Z560X, Kubota KX series, Vermeer BC1000) when estimating parts and resale.
Behavioral and sourcing tips
Human factors alter utilization and costs:
Practical how‑to: use three months of timesheets or GPS logs to estimate realistic hours, call three local rental houses for rate checks, and add a conservative 10% to maintenance estimates. Next, the methodology section will show how these inputs become comparable outputs under transparent assumptions.
Putting the Calculator to the Test: Methodology and Assumptions
Representative business profiles and equipment classes
To make results actionable, the tester defined three archetypes: a solo operator (zero‑turn mower like a Husqvarna Z560X), a small crew (compact excavator, Kubota KX018‑4), and a multi‑crew contractor (chipper such as Vermeer BC1000). Each profile included typical fleet size, average job length, transport needs, and expected annual hours so outputs map to real decisions.
Data collection and consistency checks
They gathered market inputs from several, independent sources to avoid bias:
Simple consistency checks flagged anomalies: compare rental daily×20 to monthly quoted rates; cross-check a used unit’s price against depreciation curves. Outliers were queried and discarded or adjusted.
Normalizing assumptions
To compare apples to apples, the tester standardized core inputs:
They documented each assumption in a single reference table so readers can replicate runs.
Scenario design and sensitivity approach
Each equipment/profile ran four scenarios: baseline, high‑utilization (+30–50% hours), low‑utilization (−30–50%), and edge cases (frequent breakdowns, sudden rental rate spikes). Sensitivity tests varied one input at a time (purchase price ±20%, maintenance ±50%, rental rate ±30%, utilization ±50%) and produced simple break‑even and tornado charts. The tester recorded which variables flipped the rent/buy recommendation and flagged where results were robust versus fragile.
The next section applies this framework to three real businesses to show the calculator’s recommendations in practice.
Three Real-World Case Studies: How the Calculator Performs in Practice
1) Solo residential operator — Husqvarna Z560X (seasonal peaks)
Inputs
Outputs & interpretation
Why the calculator favored buying
When non-financials override
Practical lesson
2) Medium commercial crew — Kubota KX018‑4 + three mid-size mowers
Inputs
Outputs & interpretation
Why split recommendation
When non-financials override
Practical lesson
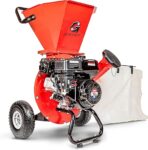
3) Large contractor — Vermeer BC1000 chipper (sporadic heavy use)
Inputs
Outputs & interpretation
Why renting wins
When non-financials override
Practical lesson
Next up: a sensitivity deep-dive to show which inputs flip these recommendations and how to stress-test a purchase decision.
Sensitivity and Break-even Analysis: Which Variables Move the Needle
What to stress-test and why
A few inputs typically flip a recommendation: annual utilization, local rental price, maintenance/downtime, financing costs, and resale value. Heavier items (chippers, excavators) are most sensitive to hours and resale; smaller items (handhelds, mowers) are sensitive to utilization and downtime. A quick stress-test reveals where the decision is fragile and where it’s robust.
How to run a quick sensitivity sweep
- Set a base case (most likely hours, local rents, interest, expected resale).
- Vary each input ±20–30% independently; note which change flips rent/buy.
- Build three scenarios: optimistic (higher hours, lower maintenance), base, pessimistic (lower hours, higher costs).
- Use a simple tornado chart or ranked list to show the biggest swings.
Simple break-even formulas (how-to)
If rental is quoted daily, convert: rental rate per hour ≈ daily rate ÷ billable hours/day (commonly 6–8).
Illustrative thresholds (real-world rules of thumb)
Dealing with uncertainty and optionality
Treat optimistic estimates skeptically. Add a safety margin (e.g., require 15–30% more hours than projected before buying). Prefer renting when demand is volatile, contracts are short-term, or technology/ emissions rules could make assets obsolete. In practice, many firms hybridize: own core high-hour fleet, rent specialty or surge capacity.
Practical Recommendations and an Implementation Checklist
Quick decision checklist
Use this compact checklist at the next equipment decision meeting. If more than two items fail, favor renting.

How to negotiate short rentals and leases
Ask for weekday/weekend discounts, weekly caps on daily rates, and dry‑hire vs. operator pricing. Negotiate free pickup/delivery within X miles and a capped damage waiver. For short-term leases, insist on an early‑termination clause tied to project milestones. If renting frequently from one supplier, secure a standing rate or a fleet agreement.
Hybrid fleet rules
Own core, high‑utilization items (zero‑turn mower, skid steer) and rent specialty or surge gear (stump grinders, tracked mini‑excavators). One landscaper kept a Husqvarna Z560 and rented a 6‑inch chipper during peak season—reducing idle capital and avoiding long-term maintenance obligations.
Bookkeeping and cadence
Track actual hours with hour meters, retain maintenance logs, and reconcile monthly TCO vs. the calculator’s projection. Record downtime events and repair costs to refine assumptions.
This practical checklist gets the business from analysis to action and prepares them to finalize the equipment decision in the following Conclusion.
Making the Right Equipment Decision
A rent vs buy calculator is a practical, quantitative tool that helps landscaping owners compare costs, cash flow effects, and tax impacts, but its output is only as good as the assumptions fed into it. They should treat the result as one input among others — equipment availability, lead times, maintenance capacity, crew flexibility, and risk tolerance — and weigh qualitative factors alongside the numeric recommendation before committing capital.
Use the checklist in this article, run scenarios quarterly, and update key inputs when utilization, interest rates, or project mix change. Doing so keeps decisions aligned with evolving business priorities and reduces the chance of costly mistakes. They should consult advisors when stakes or uncertainties are unusually high.


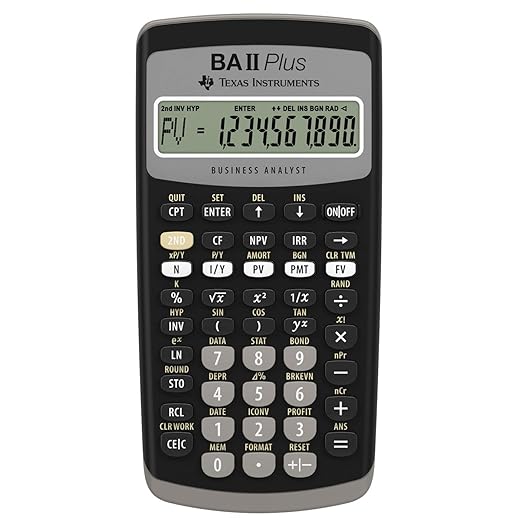
Nice walkthrough of the BA II Plus assumptions — as a numbers guy I appreciate the transparency. That said, I’m a bit skeptical about the discount rate choice in the examples. Small businesses often face higher capital costs than a standard 6% assumption.
Did you run the sensitivity analysis with a 10-15% cost of capital? I feel like that flips some of the buy decisions into rent pretty quickly.
Good catch — we did run additional sensitivity checks up to 15% and included those results in the supplemental files (briefly discussed in the ‘Sensitivity and Break-even Analysis’ section). You’re right: higher capital cost shifts the needle toward renting in several scenarios.
Thanks Marcus — I was wondering the same. For my fleet, once I used 12% the calculator recommended renting the chipper more often.
Really practical article. I appreciated the transparency in the ‘How a Rent vs. Buy Calculator Works’ section — knowing which metrics drive the outputs (depreciation, maintenance, utilization) makes the tool actually usable.
A few requests for improvement:
1) Could you include downloadable CSVs for the three real-world case studies so we can plug them into our own sheets?
2) Expand the maintenance line items — e.g., tire wear on the Ariens IKON Onyx and periodic belt replacements.
3) Maybe a short video demo of the BA II Plus inputs for readers who struggle with financial calculators.
Thanks — this is a helpful roadmap for shop owners.
Also maybe add a simple spreadsheet alternative for people who don’t want to buy a BA II Plus. A free Google Sheets template would be amazing.
Yes to the BA II Plus video — I had to YouTube a few tutorials when I first used it.
CSV downloads would be a lifesaver. I prefer copying examples into my own templates before trusting them.
Great suggestions, Hannah. We’ll add CSV downloads for the case studies and a short BA II Plus walkthrough video. We’ll also expand the maintenance checklist to include tires, belts, and hydraulic service items for the zero-turn.
Echoing all of the above — templates and samples make adoption way easier for small businesses.
Great piece — finally, an article that treats rent vs buy like a real business decision and not just an opinion. I liked the case studies section the most (real numbers = useful). A few thoughts/questions:
– The Ariens IKON Onyx 52″ is mentioned in the case study — did you include insurance and trailer costs when you modeled ownership? Those sneaky extras change the break-even a lot.
– The Equipment Maintenance Log Book mention made me smile — nothing beats tracking oil changes and blade hours when you’re deciding to buy.
– Would love a quick checklist PDF from the ‘Practical Recommendations’ section to hand to clients.
Minor nit: one of the methodology assumptions felt optimistic on utilization rates. Otherwise, great job — learned a lot!
Agreed about trailer costs — they often get forgotten. Also factor in storage fees if you don’t have onsite space.
Thanks, Emily — great point. In the Ariens model we included a simplified insurance estimate and trailer amortization, but we flagged both as sensitivity variables in the appendix. I’ll upload a one-page checklist/PDF in the follow-up post this week.
Yes! The maintenance logbook is a game-changer for me. Recording run hours made my replacement timing so much clearer.
Wow, this article hits a sweet spot. I actually used the calculator approach in my small crew last season and it saved us a ton — we rented a GreatCircleUSA chipper for big jobs and bought the Ariens mower for daily work. 😅
Couple of real-world notes:
– Renting bulky stuff for occasional jobs keeps cashflow flexible.
– The case study about utilization rates nailed it — if you do <80 hours/year on a piece of equipment, renting usually wins.
Would love to see a follow-up that compares hourly rental rates across common rental houses vs. ownership costs.
Agree 100%. I keep a list of local rental rates and always run quick math — renting that wood chipper saved me a headache (and my back) last year.
Priya — curious which maintenance items you tracked in the logbook? Did you track downtime separately?
Nice! Love the combo approach — rent the heavy, buy the daily tools. Smart and cash-friendly.
Thanks for sharing your experience, Priya — that’s exactly the kind of practical validation we wanted. We’re planning a follow-up that compiles rental house rates regionally and ties them into the calculator inputs.
Hah, this article almost made me convert to a spreadsheet monk. The sensitivity analysis was a tiny bit scary — numbers moving all over the place like my mower on tall grass 😂
Also: does anyone else feel weird clicking Amazon links for the GreatCircleUSA chipper? I get it, convenient, but I still wanna test-drive a chipper IRL before committing. And maintenance logbooks are underrated — my techs actually fill them out when I bribe them with pizza.
Totally fair, Owen. We linked products for convenience, but we recommend hands-on demos for bigger purchases like a chipper or zero-turn mower. And pizza is a proven maintenance-book incentive!
Lol pizza incentive = gold. Also, demoing equipment lets you inspect build quality and ergonomics — things the calculator can’t quantify easily.
Quick tip: if you’re on the fence, rent the GreatCircleUSA chipper for the first big season and buy the Ariens mower if you’re doing weekly residential work. Saved me tons of upfront cash. 🙂
Solid advice. Also keep the Equipment Maintenance Log Book handy to track wear if you end up buying the chipper later.
Thanks for the practical tip, Carlos — that’s exactly the hybrid approach we recommend in the ‘Practical Recommendations’ section.